NBLAST Desktop
Our reference implementation of NBLAST is available through the function nblast provided through our R package nat.nblast.
In addition to basic pairwise comparison, the package implements search of databases of neurons.
There is also support for all by all comparison for a group of neurons.
This can produce a distance matrix suitable for hierarchical clustering, which is also implemented in the package.
These tools are designed as an addon for the NeuroAnatomy Toolbox (nat) R package, which will be installed as as dependency.
Data
The source data for the nblast function includes the reformatted FlyCircuit neurons processed as a dotprops (aka vector cloud) objects. These are accessible as a single R object of class neuronlist named dps.
To load the dps object into R follow these commands.
if(!require("devtools")) install.packages("devtools")
devtools::source_gist("bbaf5d53353b3944c090", filename = "FlyCircuitStartupNat.R")
See https://gist.github.com/jefferis/bbaf5d53353b3944c090 for further details.
You can also download the original registered image data here(2Gb).
The dotprops data for the GMR (Janelia) GAL4 lines is also available. It can be (down)loaded into R using
library(flycircuit)
gmrdps<-read.neuronlistfh("http://flybrain.mrc-lmb.cam.ac.uk/si/nblast/gmrdps/gmrdps.rds", localdir=getOption('flycircuit.datadir'))
remotesync(gmrdps, download.missing = TRUE)
it can then be used as a target for nblast searches. You can omit the remotesync command in subsequent sessions where you just want to use the downloaded data. Note the download (8.4Gb) will take a while depending on your distance from Cambridge …
Installation
Prerequisites
As well as development versions available from GitHub through the previous links, stable versions are periodically released to CRAN (nat and nat.nblast). These can be installed in an interactive R session via the following command:
install.packages('nat.nblast')alternatively to use the latest development versions:
devtools::install_github(c("jefferis/nat", "jefferislab/nat.nblast"))Kenyon cells example
Below, we briefly show how our R packages can be used to cluster Kenyon cells using NBLAST, and show that they match the neuronal types defined by lobe innervation. To follow along, simply copy and paste the code below into an interactive R session.
# Create a 20 x 20 NBLAST score matrix for 20 Kenyon cells included with the nat package
library(nat.nblast)
library(nat)
kcscores <- nblast_allbyall(kcs20)

# Hierarchically cluster the Kenyon scores
hckcs <- nhclust(scoremat=kcscores)

# Divide the hierarchical clustering into three groups
library(dendroextras)
dkcs <- colour_clusters(hckcs, k=3)

# Plot a dendrogram of the clustering, with leaves labelled by true neuron type
labels(dkcs) <- with(kcs20[labels(dkcs)], type)
plot(dkcs)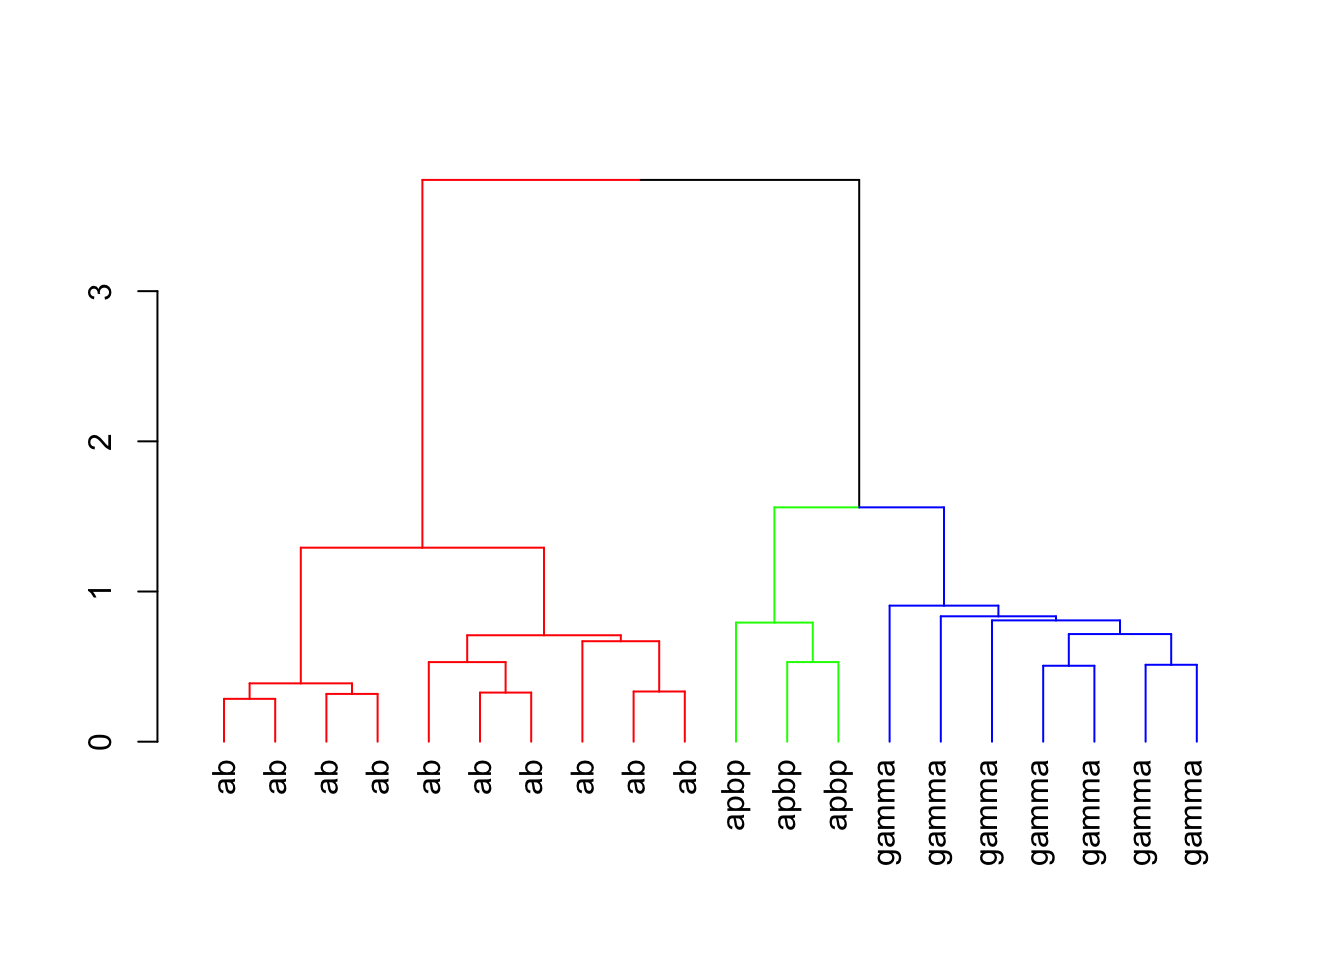
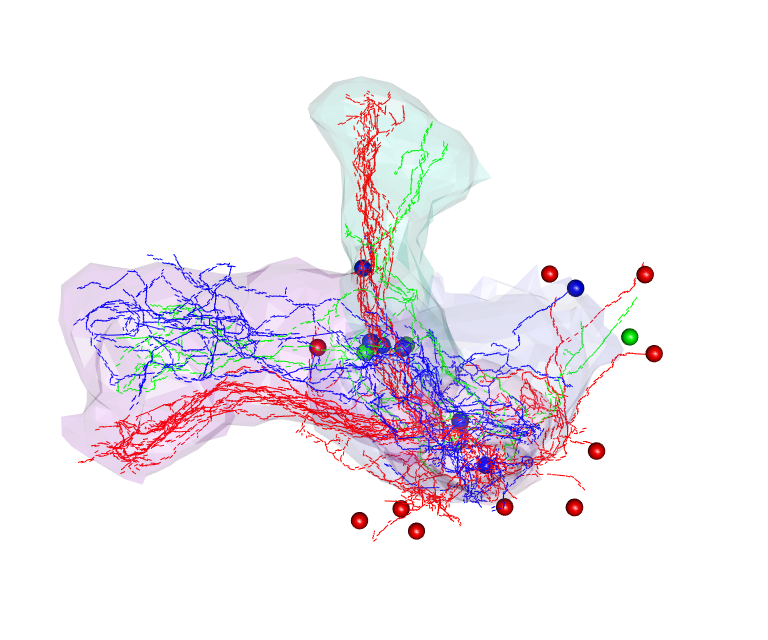
# Plot neurons in those clusters in 3D (with matching colours)
open3d()
plot3d(hckcs, k=3, db=kcs20, soma=T)
par3d(userMatrix=diag(c(1,-1,-1,1), 4))
plot3d(MBL.surf, alpha=.1)